This website documents research related to variable speed light theory. The research was originally designed as an experiment to replace the Michelson-Morely Experiment (MME) and the results were expected to demonstrate a null result as was reported by the MME. However, the new design of the experiment uses radio waves instead of photons and measures changes in wavelength rather than looking for a difference based upon distance traveled by a photon. The results obtained were most certainly unexpected, but clearly show an anisotropic difference that was not present in the MME. This research clearly demonstrates that the speed of light is variable. This website documents that research and will remain a public repository for the raw data obtained during experimentation.
Simply put, there is no disagreement in the scientific community regarding the equation ⅽ = ƒ λ which describes electromagnetic propagation. It has been well established though experimentation that when the frequency of an electromagnetic wave is multiplied by the wavelength of the electromagnetic wave, they result will always be numerically equal to the speed of light (which is also the speed of electromagnetic propagation though space). It is from this understanding that this experiment was designed. As such, the experimenter transmits a radio signal at an assigned frequency and then measures the wavelength of the signal as the instrument is rotated 90 degrees. Unless the frequency changes or there is an increase/decrease in the electrical signal sent to the antenna, there can be no change in the wavelength of the signal. If there is a change in the wavelength of the signal that is caused by changing the direction of the antenna (known as an anisotropic difference) then it must be due to a change in the electromagnetic propagation velocity. If this sounds a bit simple, please realize that I have summed the experiment up in one paragraph but the original document describing this experiment is much longer. You can also explore this website to learn more specifics about this experiment.
The experiments listed below are samples of results obtained from recent experiments. They are not provided in chronological order. These experiments demonstrate the experiment being completed at various voltage inputs and at various frequencies and with various oscilloscope input settings. These experiments were completed at different times and not every experiment utilized the exact settings described in the associated paper that describes this experiment. Furthermore, not every experiment had every setting clearly documented as occurred during the most recent experiments. As such, the details listed below are noted for some experiments described below, but not for all of the experiments. For best results in reproducing the experiment, use the settings described in the published article regarding this experiment.
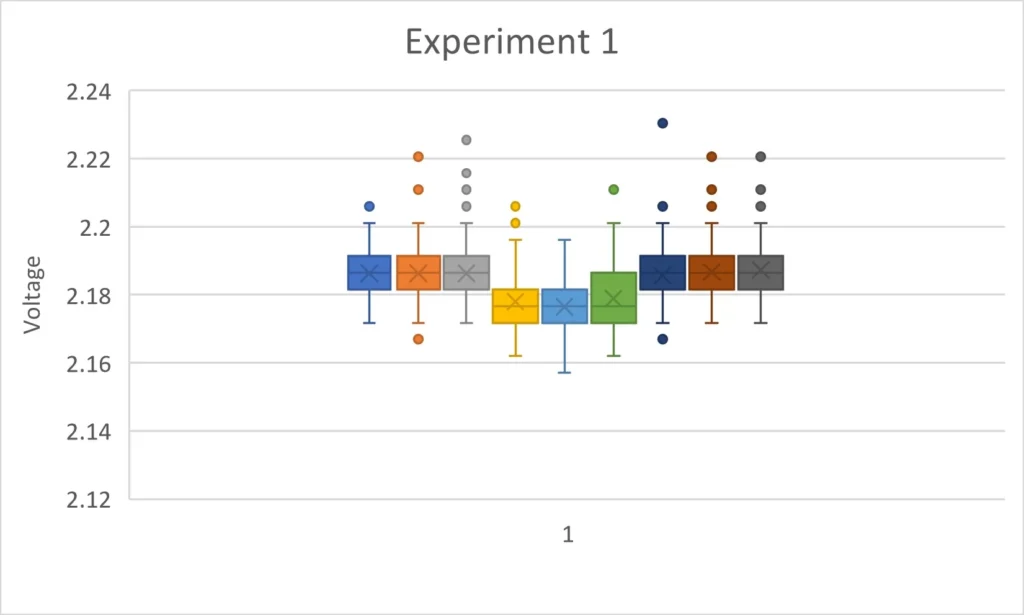
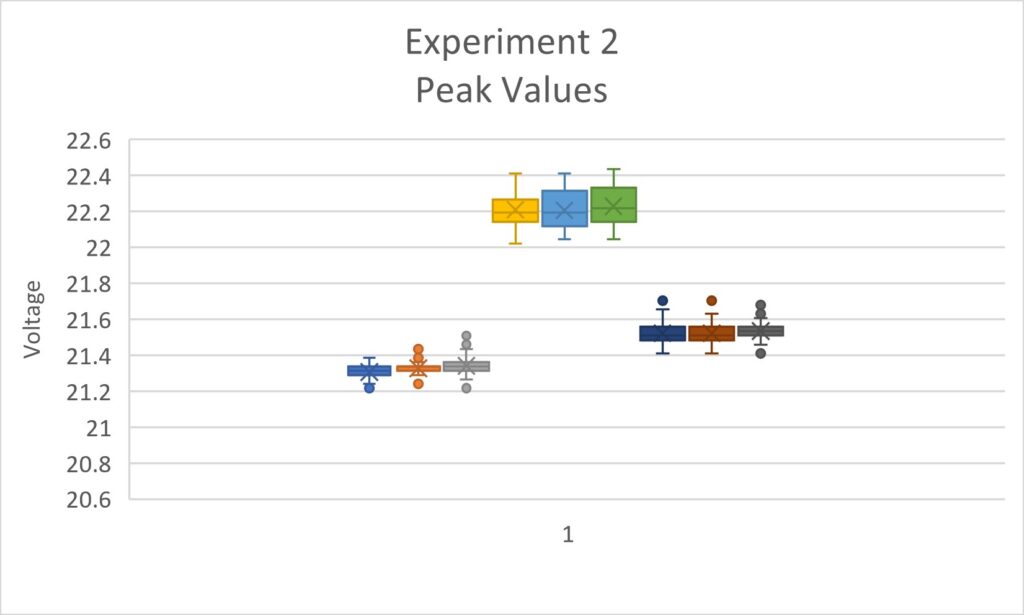
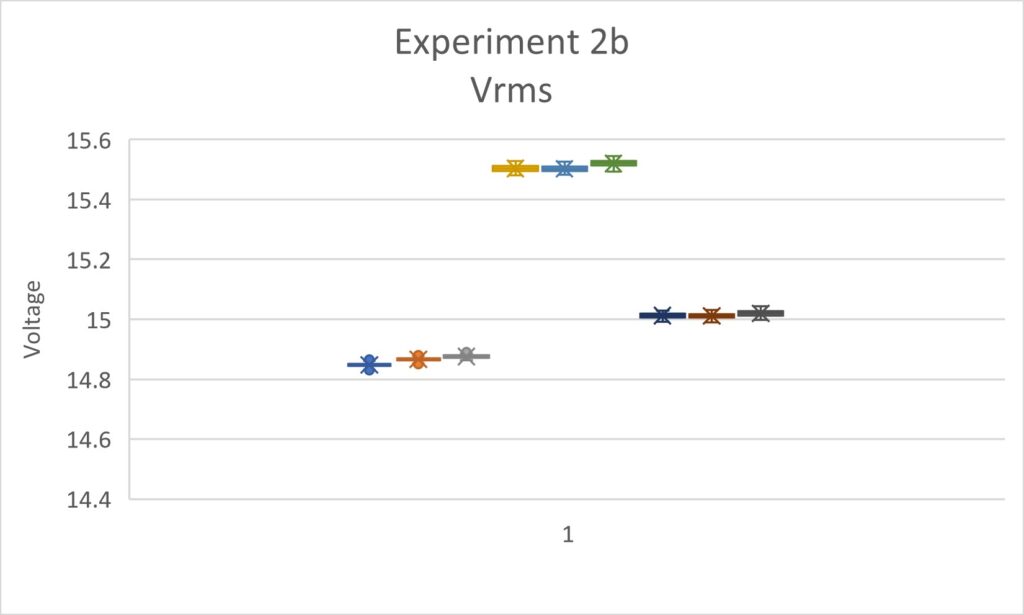
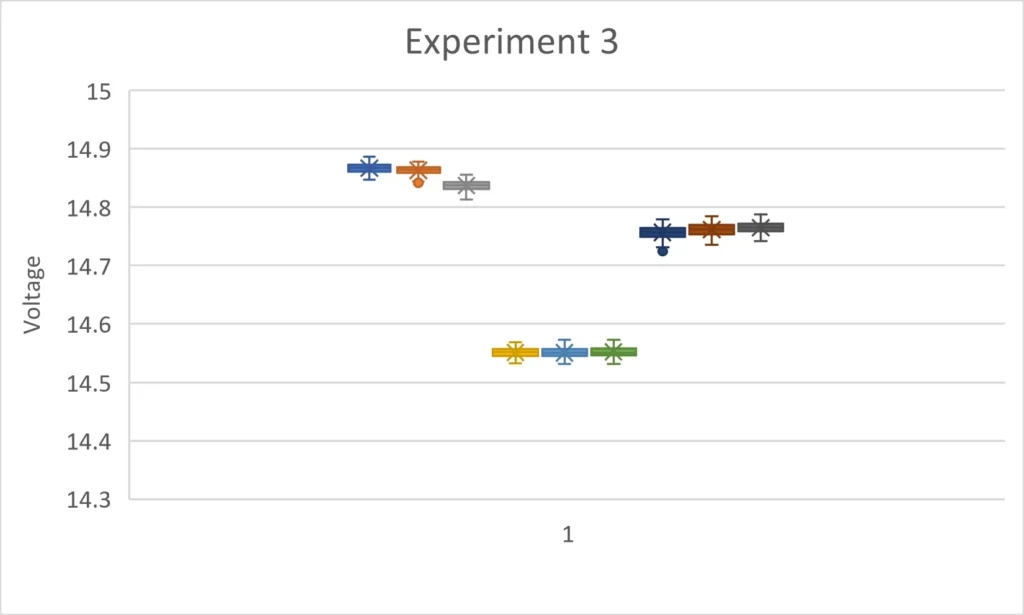
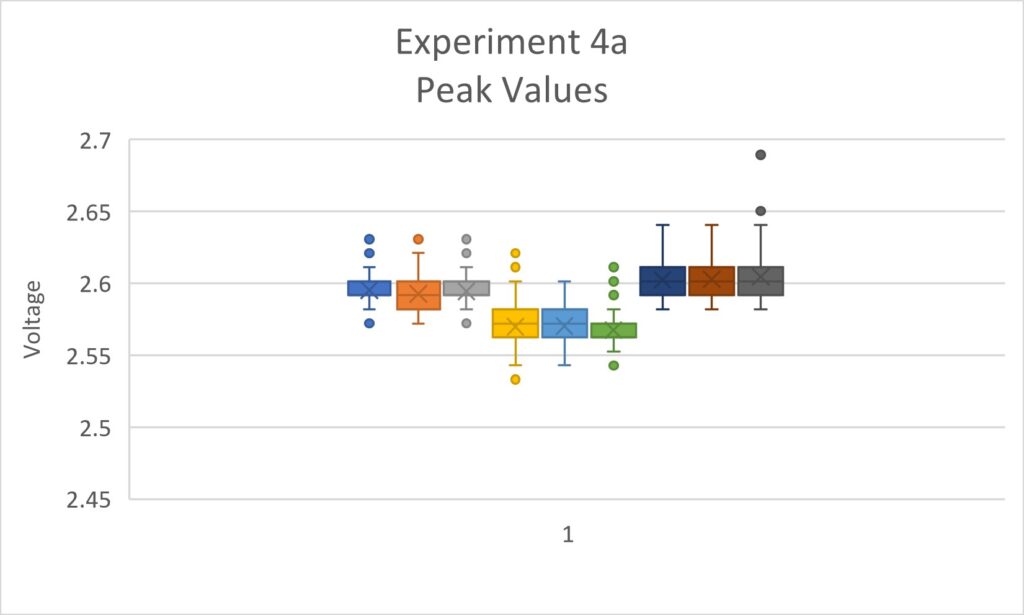
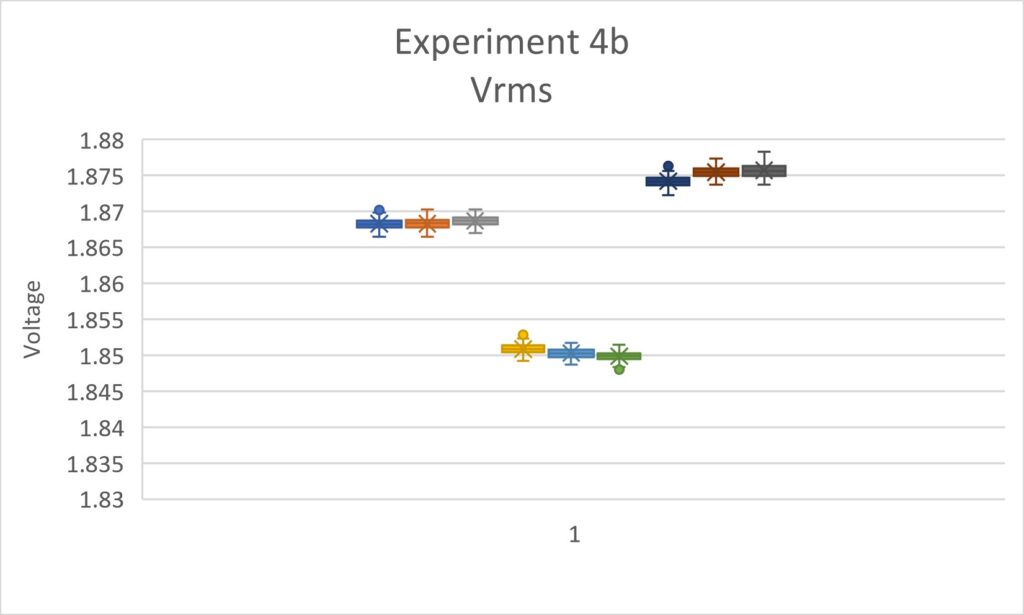
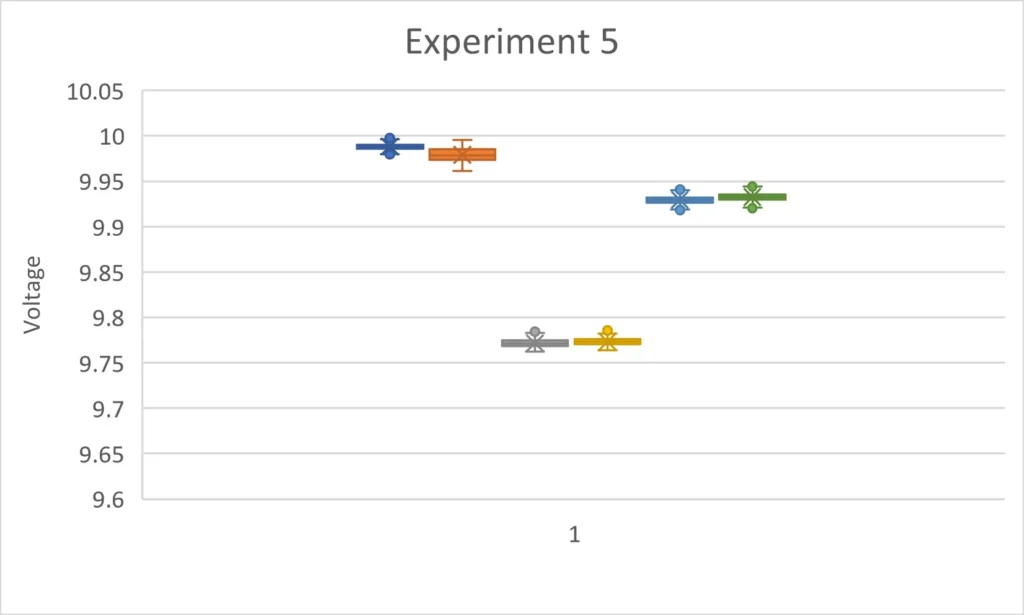
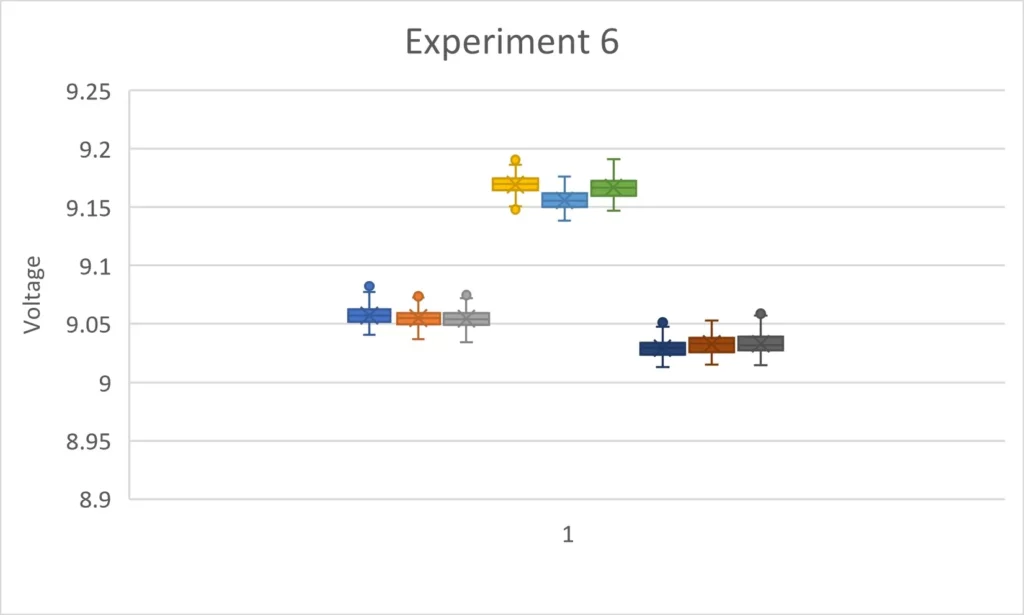
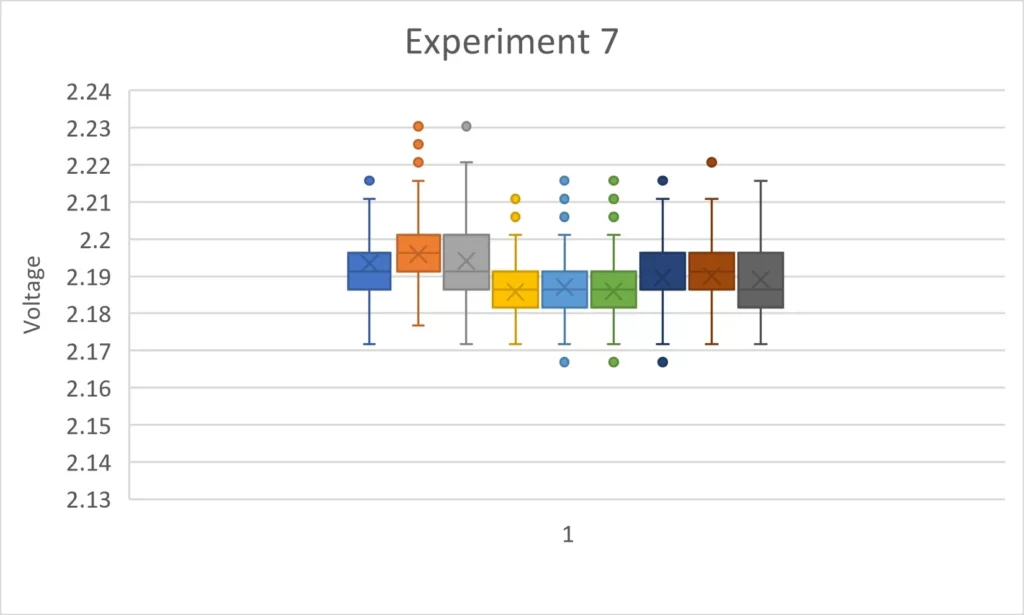
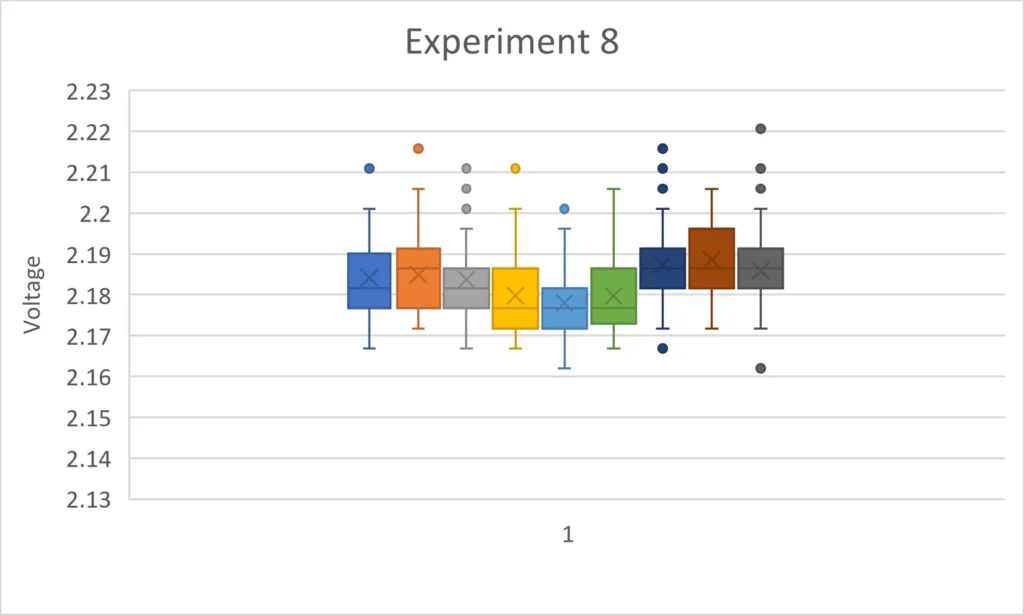
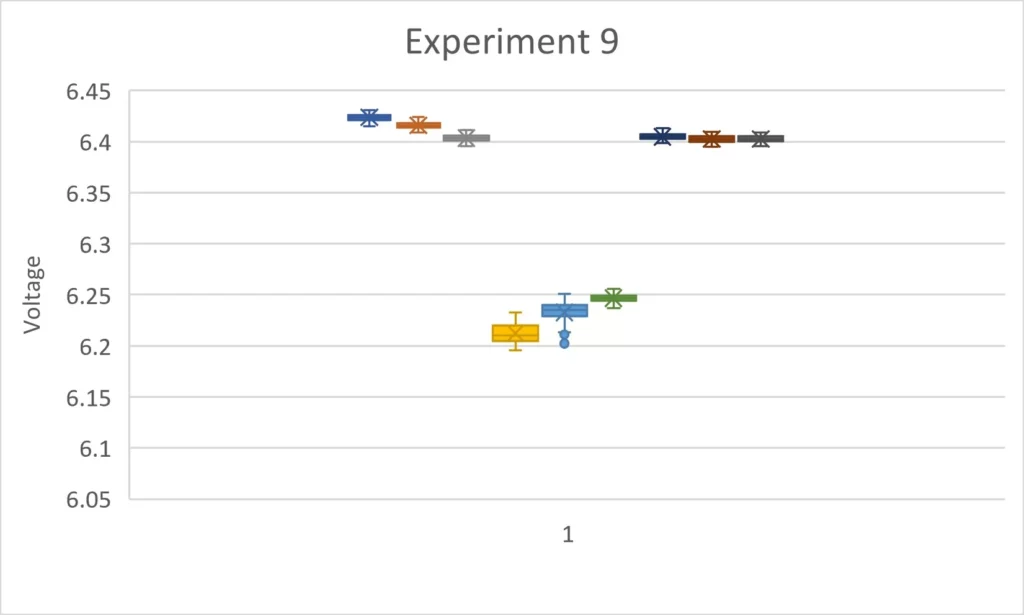
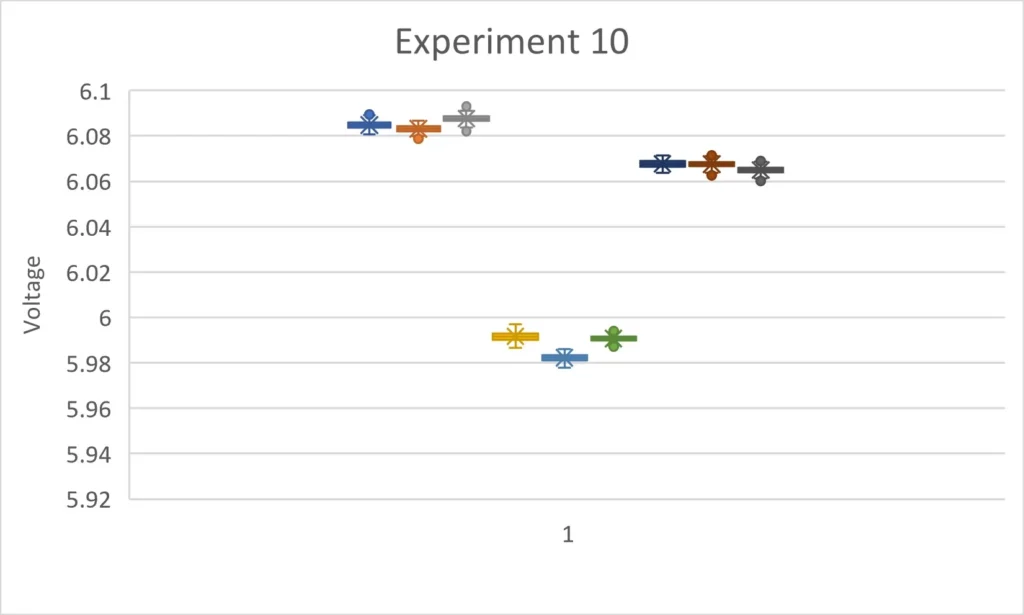
The experiments presented below use a box and whisker chart to graphically demonstrate the data obtained. For the standard experiment, nine sets of measurements were obtained. Each box plot represents one set of measurements. Box plots 1 through 3 are with the instrument pointed toward the star Regulus. Box plots 4 through 6 are with the instrument pointed 90 degrees away from Regulus. Box plots 7 through 9 are with the instrument returned to a position with the instrument pointing toward the star Regulus. Graphical representation of the anisotropic difference is noted when box plots 4 though 6 are at an obviously different value than the other measurements.
You will notice that on some experiments the anisotropic difference causes an upward deflection on the chart and on other experiments there is a downward deflection on the chart. The cause for the difference in deflection is related to the position of the assigned measurement location in relation to the location of the peak voltage on the Lecher line. Measurement obtained with the assigned measurement location to the left of the point of peak voltage will show a decrease in voltage output, while the measurement obtained with the assigned measurement location to the right of the peak voltage will show an increase in voltage output.