What is anisotropy?
In physics, it is defined as “the quality of exhibiting properties with different values when measured along axes in different directions.” In a more simplified example, consider a piece of wood. Wood breaks easier along the grain than against the grain. When considering measurements in an experiment, if measurement along one axis provides a different reading than measurement obtained on a different axis, the results are described as to show anisotropy.
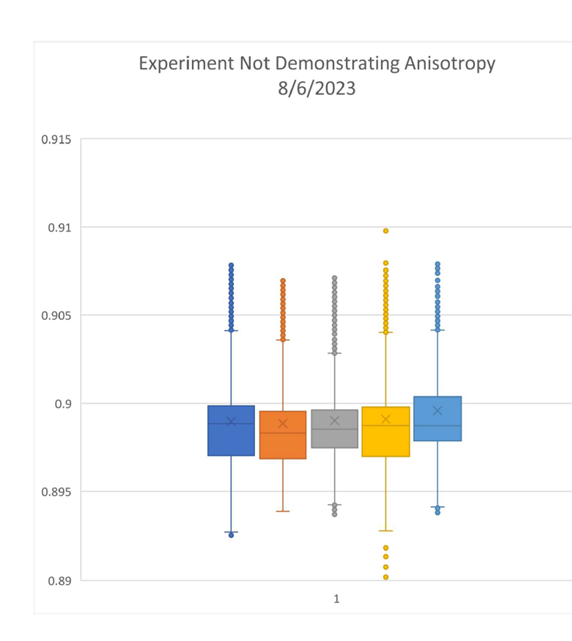
In the graph taken above, you can see a Box and Whisker graph of results obtained during an experiment. You can see that not every box is exactly the same in length and that the top and bottom of the boxes are not exactly equal. This is not a clear demonstration of anisotropy. It is actually demonstrating the baseline variation that is consistent with this experiment. Furthermore, if this experiment were to demonstrate results that showed c as a constant, this would be how these results would look on a graph.
What does anisotropy look like?
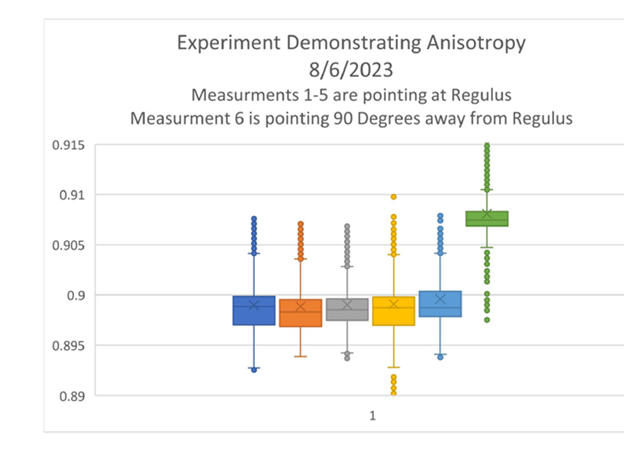
In the graph below you can see the exact same results that are on the above graph. The graph below has one additional measurement that is measurement 6 and is on the far left of the graph. This measurement was intentionally left out of the graph above to demonstrate anisotropy as would be observed in the results of this experiment. The measurement to the far left is much higher on the graph and demonstrates about an 8-millivolt difference between the elevated measurement and the baseline measurement. Such a clear deviation that occurs only when the instrument is pointed in another direction is a clear sign of anisotropy.
What is anisotropic difference?
The difference between the measurements noted when the instrument is pointed at Regulus and when the instrument is pointed 90 degrees from Regulus is known as the anisotropic difference.