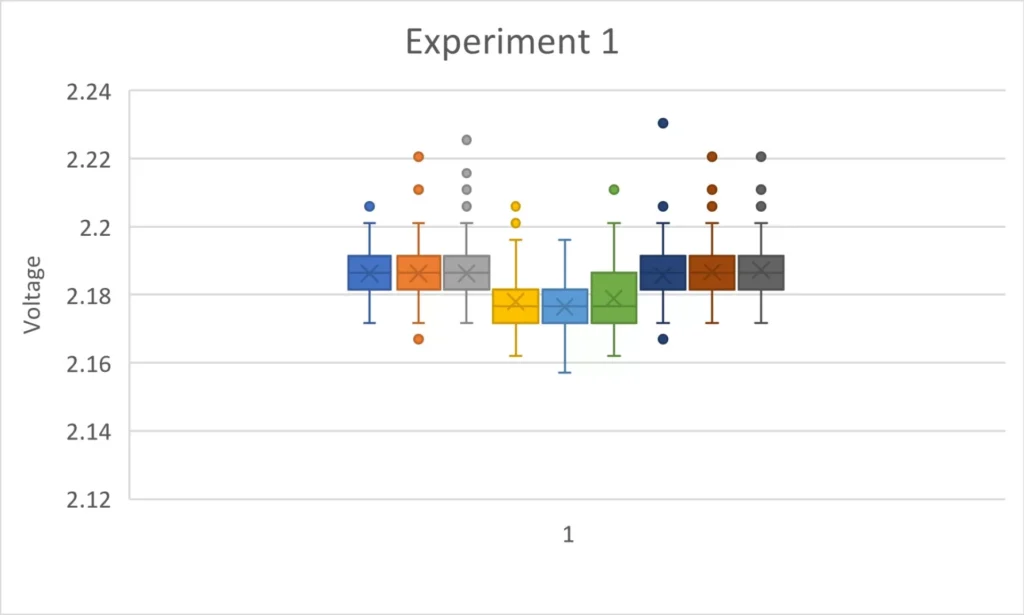
The results demonstrated in this data set are the results used in the article that describes this experiment. The results clearly show an anisotropic difference. The results here were also very clean and without much interference. As you can see with the results from other experiments, not every result is as clean as this one. However, despite some minor variation that may be caused by interference, thermal variation or vibration, all of the results show a clear anisotropic difference that cannot be due to the minor variations observed.
The experiment presented uses a box and whisker chart to graphically demonstrate the data obtained. During this experiment, nine sets of measurements were obtained. Each box plot represents one set of measurements. Box plots 1 through 3 are with the instrument pointed toward the star Regulus. Box plots 4 through 6 are with the instrument pointed 90 degrees away from Regulus. Box plots 7 through 9 are with the instrument returned to a position with the instrument pointing toward the star Regulus. Graphical representation of the anisotropic difference is noted when box plots 4 though six are at an obviously different value than the other measurements.